Canada’s rising bond yields are set to drive mortgage rates higher, as fears of a recession are put aside.
The Government of Canada (GoC) 5-year bond yield hit a new multi-month high last week Friday. Yields have suddenly reversed course, as economic data has been coming in much hotter than expected. Canada’s oldest bank sees this as potentially driving home prices lower, pointing to the close relationship over the past decade.
 Government of Canada 5-year Bond yields and mortgages.
Since credit markets are competitive, Government bond yields influence interest on similar terms. When yields rise or fall, the cost of borrowing for a similar term isn’t far behind. The most notable is the 5-year GoC bond, which directly influences the 5-year fixed rate mortgage. It was the most popular mortgage product until the recent record-low rates, when people began chasing variable mortgages.
Canadian Bond yields surge, hit a new high for 2023
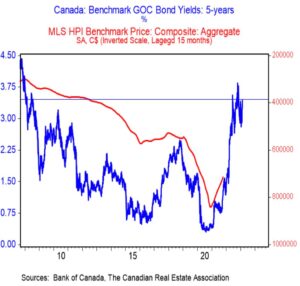
Canadian bond yields have been surging over the past few weeks, as inflation fails to cool as fast as intentions. The GoC 5-year bond closed at 3.45% on Feb 16, 2023 – a new high for 2023 and a level not seen since November 2022. At this level, the market is facing similar conditions to those seen in 2008. It might be heading higher too.
Up until a few weeks ago, the story was falling yields. In mid-January, the GoC 5-year yield had fallen to just 2.8% – reversing nearly half a year worth of climbing expectations. Over the past month, it’s added 55 basis points, ripping higher.
Solid Economic data is driving yields higher and Home prices lower.
Falling yields were triggered by softening expectations. The market had expected more indicators typical of recession to appear, such as eroding employment. That hasn’t occurred, and some would argue the economy is actually fairly robust with strong employment.
The rise in yields reflects a run of solid economic data in both economies, and the dawning realization that central banks may need to do even more than expected just a few short weeks ago, explained the Chief Economist at BMO.
In a research letter to BMO Capital Market clients last week, he touched on the implications for the housing market. Plotting home prices shifted 15 months earlier, against an inverted axis – he demonstrates the close relationship rates have had on home prices since the mid-2000’s. 
The rise in fives has big implications for an already struggling housing market. The inverted chart of home prices is meant as an indication of the lags involved – not to suggest prices are going to revert that much. But note that even with the correction or the past year, home prices are still up 30% from the pre-pandemic level.
Despite talks of falling prices, remaining 30% higher isn’t exactly the hardship that’s often presented.
If you are currently looking at purchasing a property, don’t hesitate to contact us to find out what you can qualify for.
Original article: www.betterdwelling.com


